How to use Mi-FINDS
Overview of Capabilities
The public-facing Mi-FINDS provides county- and state-level firearm fatality summaries. A restricted level of access is granted to authorized public health and public safety practitioners across Michigan. Registered users can utilize an interactive dashboard which maps firearm incidents in near real-time (i.e. daily) and provides demographic briefs. Users can select a time frame to tailor visualizations and view spatial and temporal trends in firearm injuries or generate printable reports. Data summaries can be customized by decedent demographic (e.g. age range; gender), manner of death (e.g. homicide; suicide) with an option to overlay place-based census data.
The surveillance system provides the following information to authorized users:
- Death / incident date
- Decedent demographic information (age range, race/ethnicity, gender)
- Randomly displaced incident location on a map (city, county, zip code)
- Manner of death (homicide, suicide, accidental, undetermined)
Future stages of this project will include acquiring and incorporating non-fatal injury data.
Public Dashboard Home Page
The Mi-FINDS public dashboard displays aggregate firearm injury incident data for the state of Michigan.
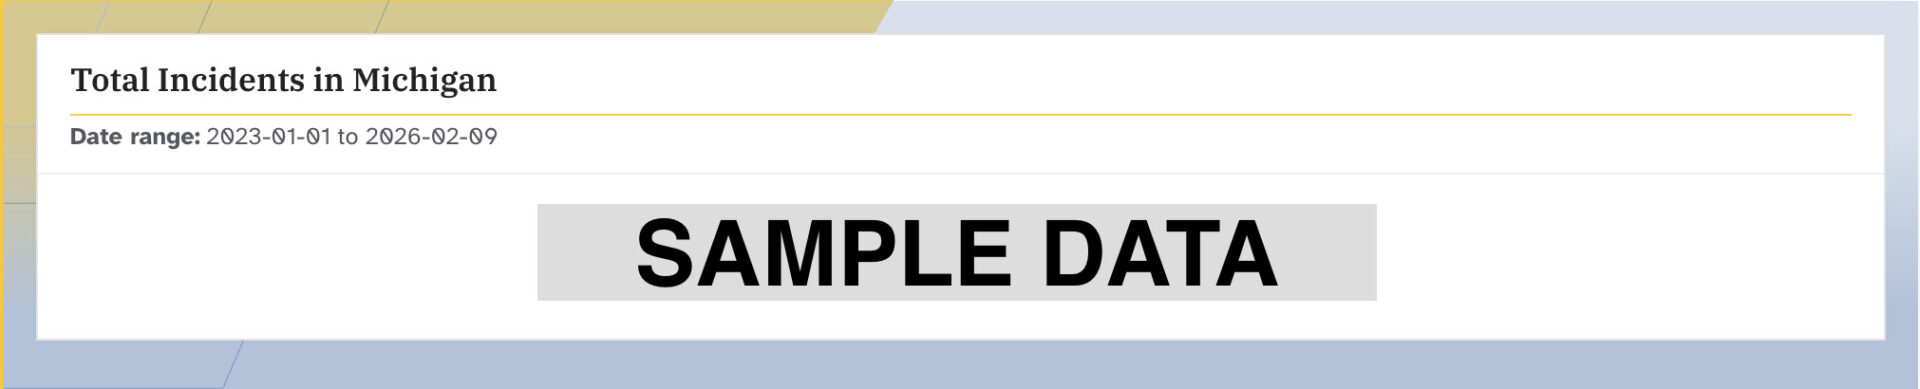
Total Incidents
At the top of the page, you will find the total number of firearm incidents in the available data set for the state of Michigan.
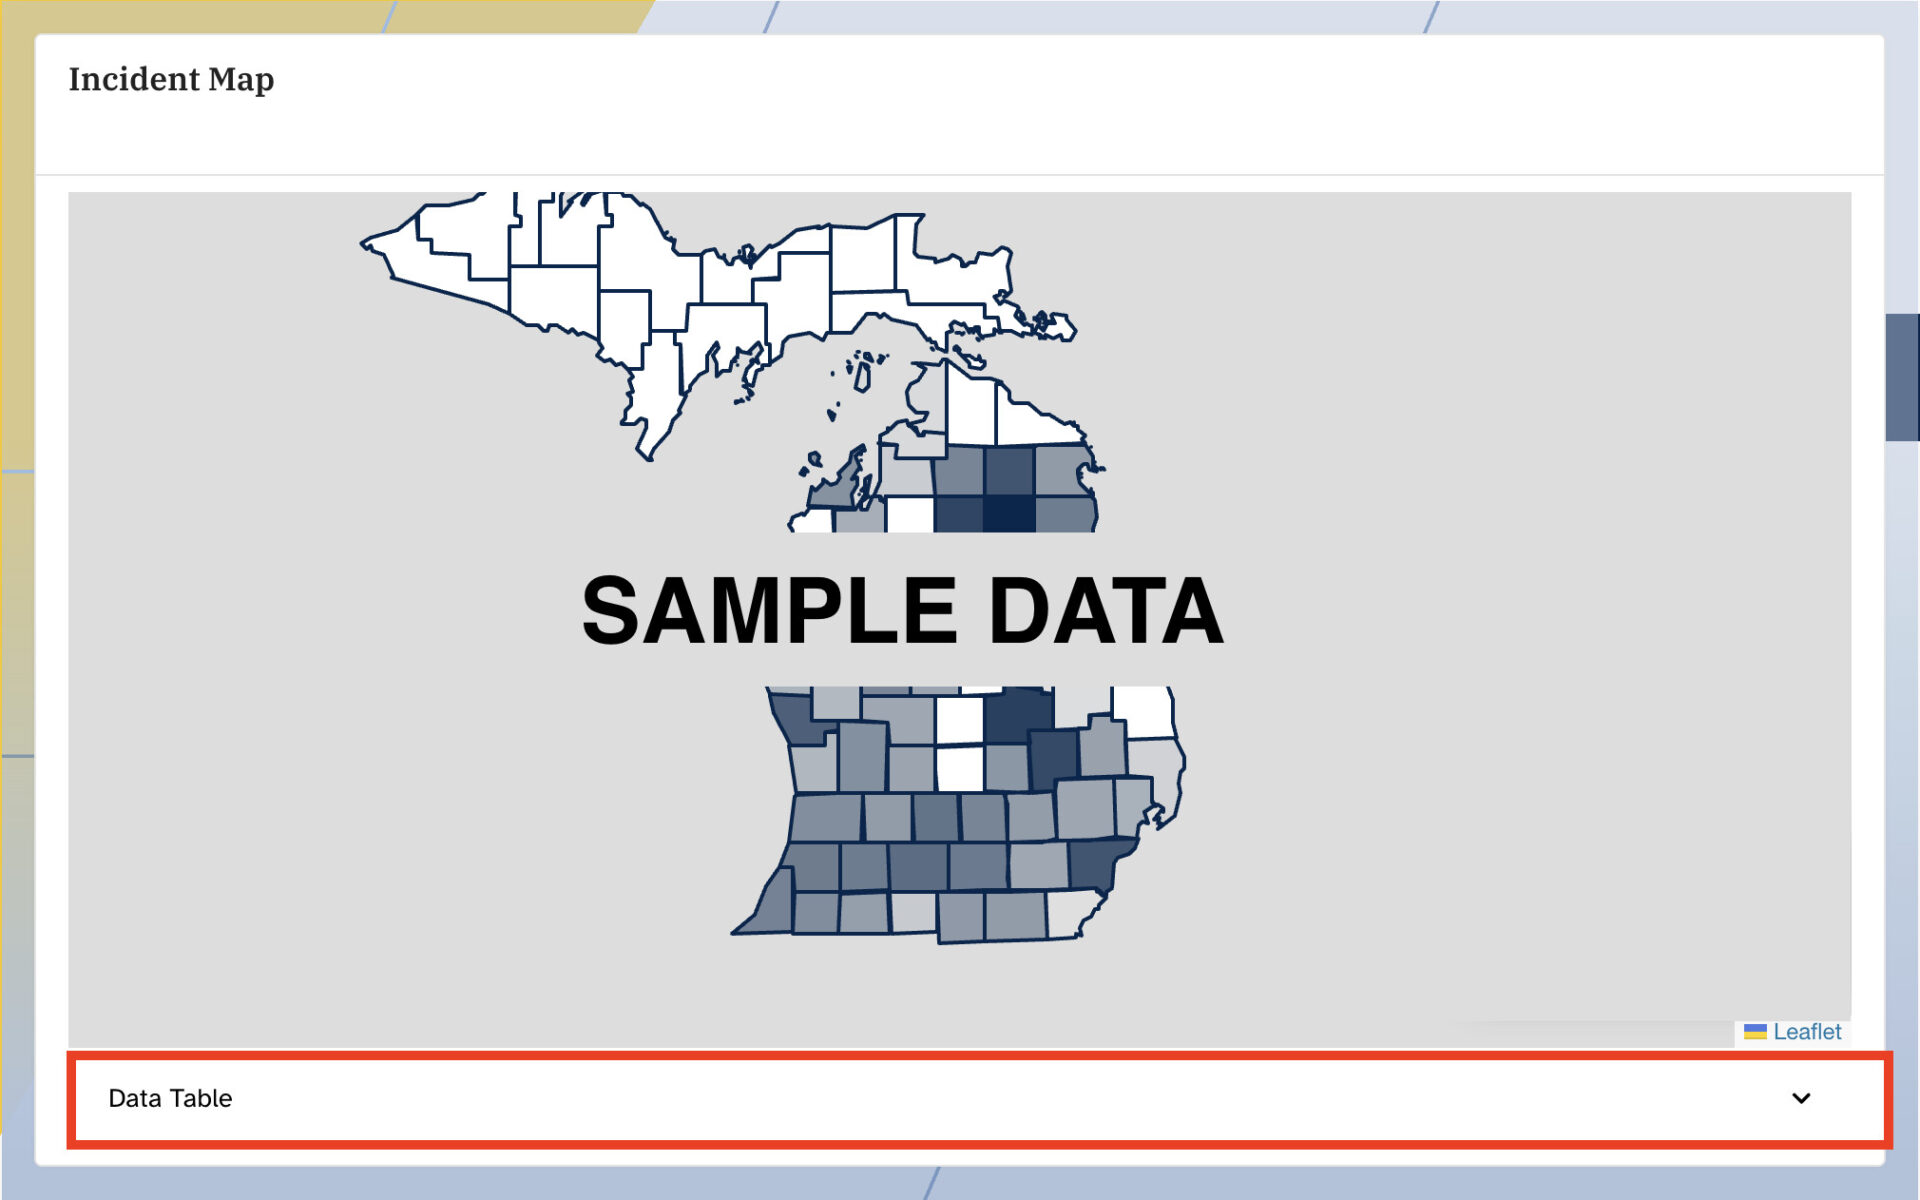
Incident Map
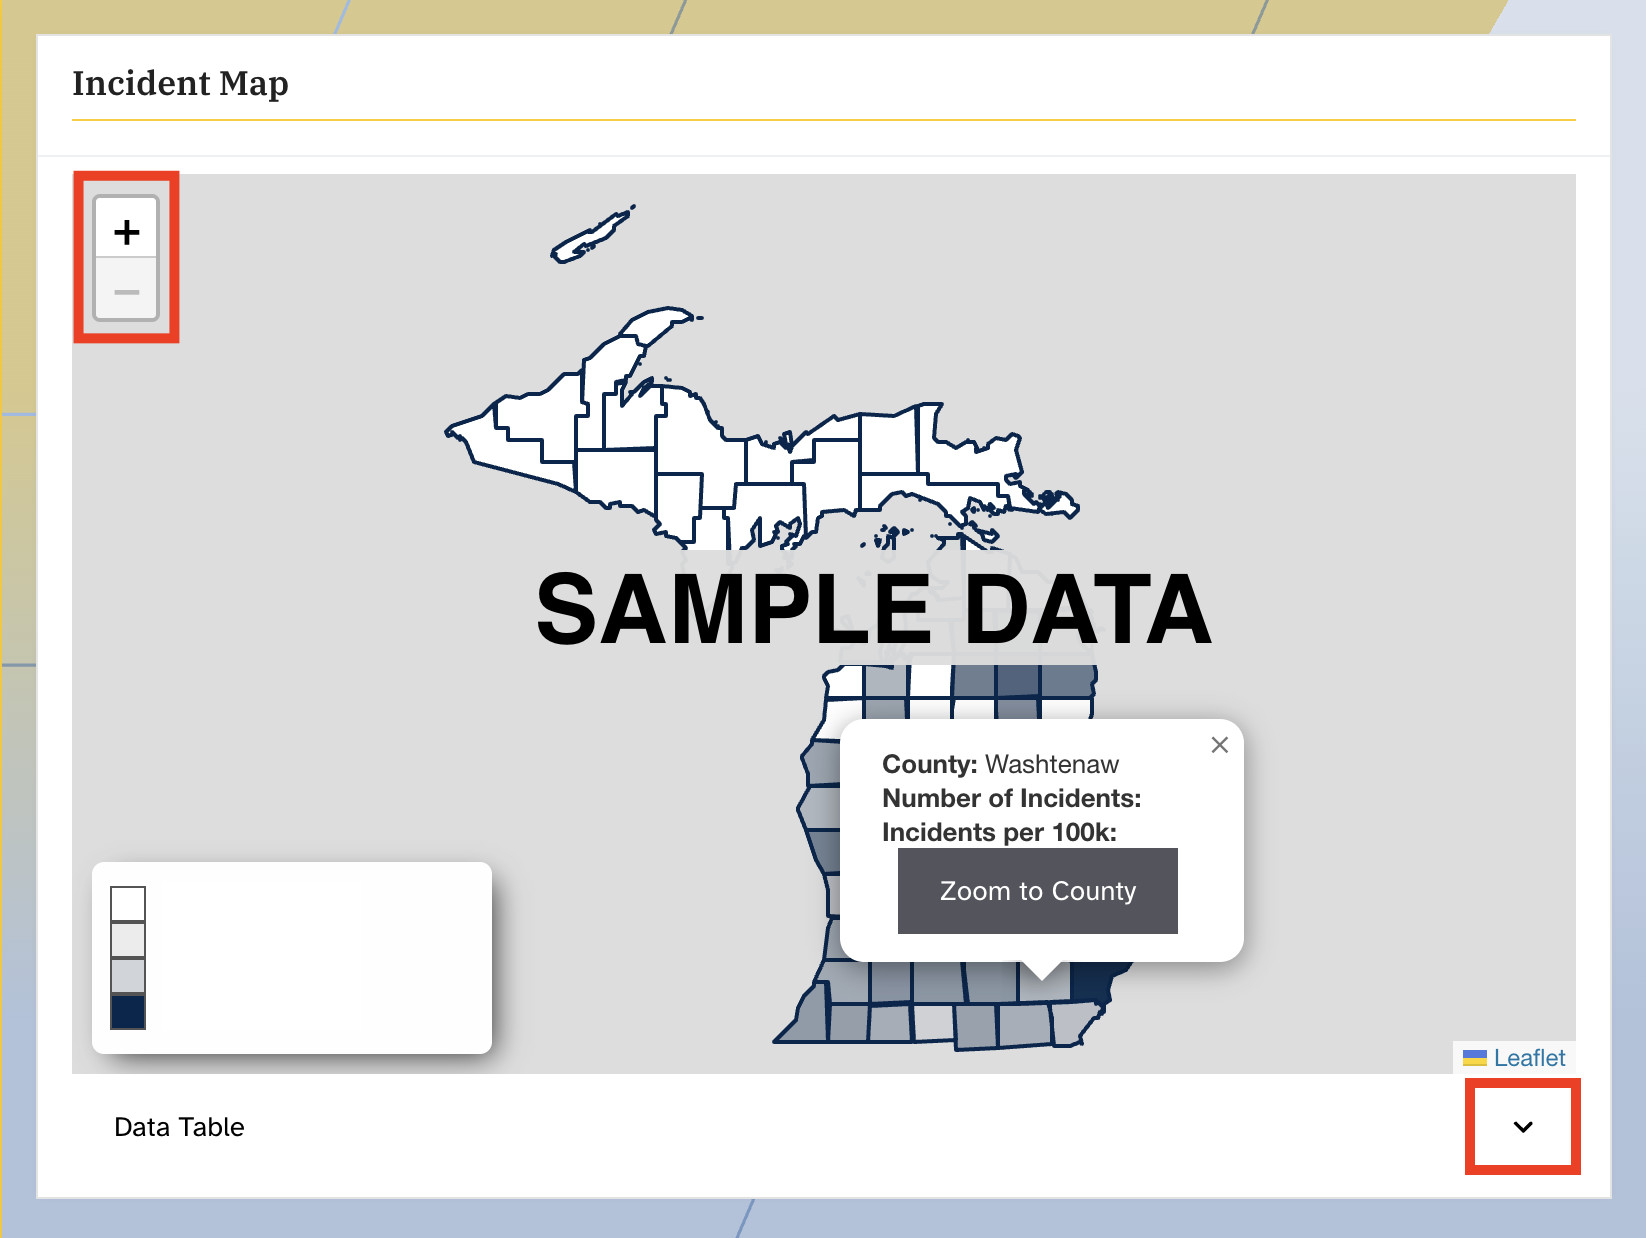
Directly underneath is the incident map, in which you can click on a specific county to open a dialog box displaying the incident county, number of incidents, and incidents per 100K. To view a further breakdown of the incident information, click on the upwards facing arrow directly underneath the map labeled ‘Data Table.’
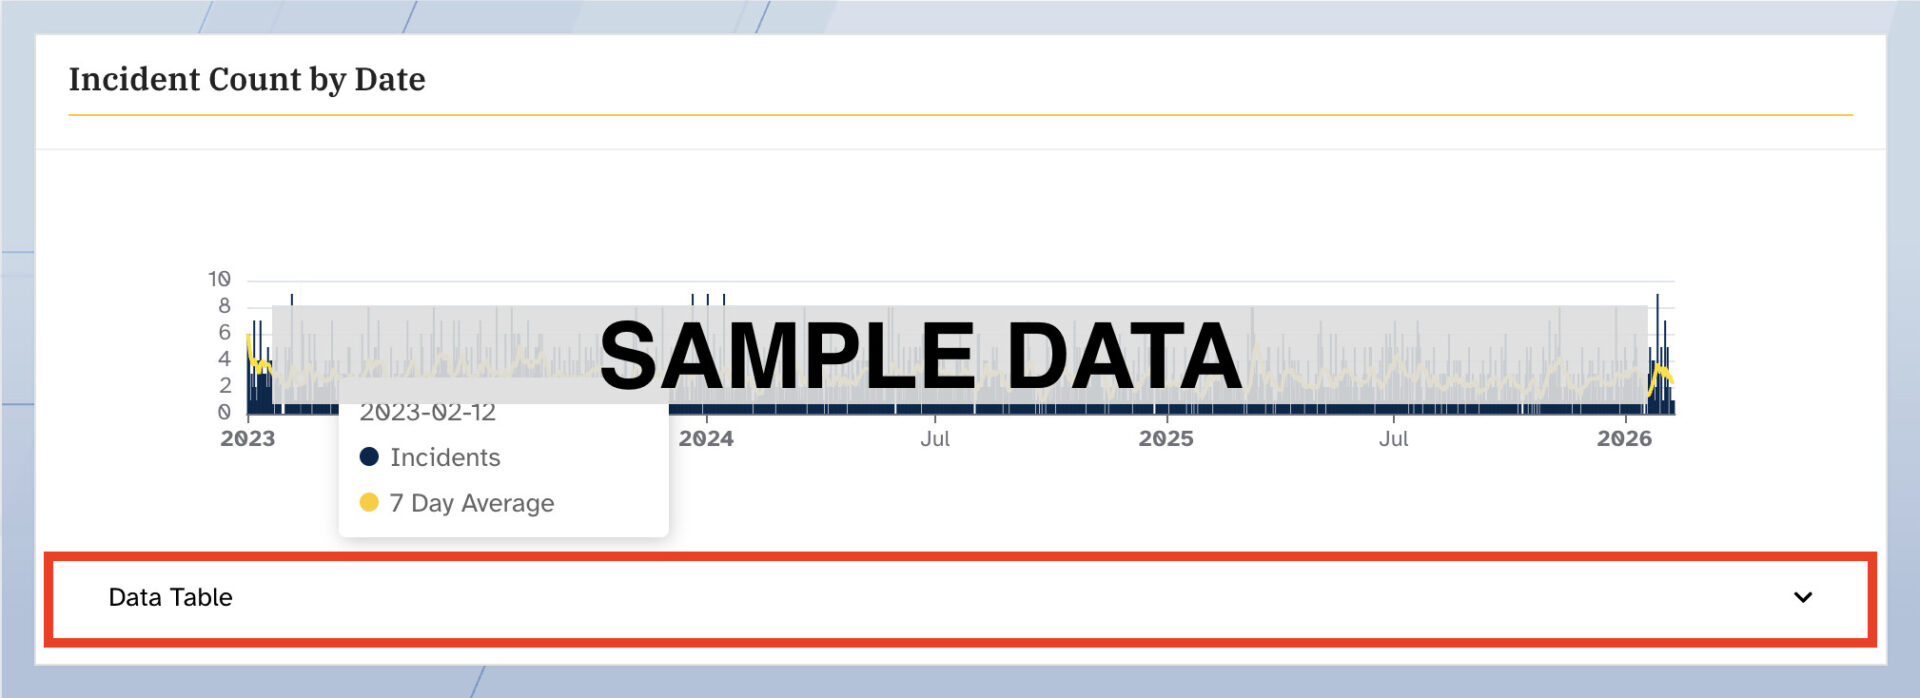
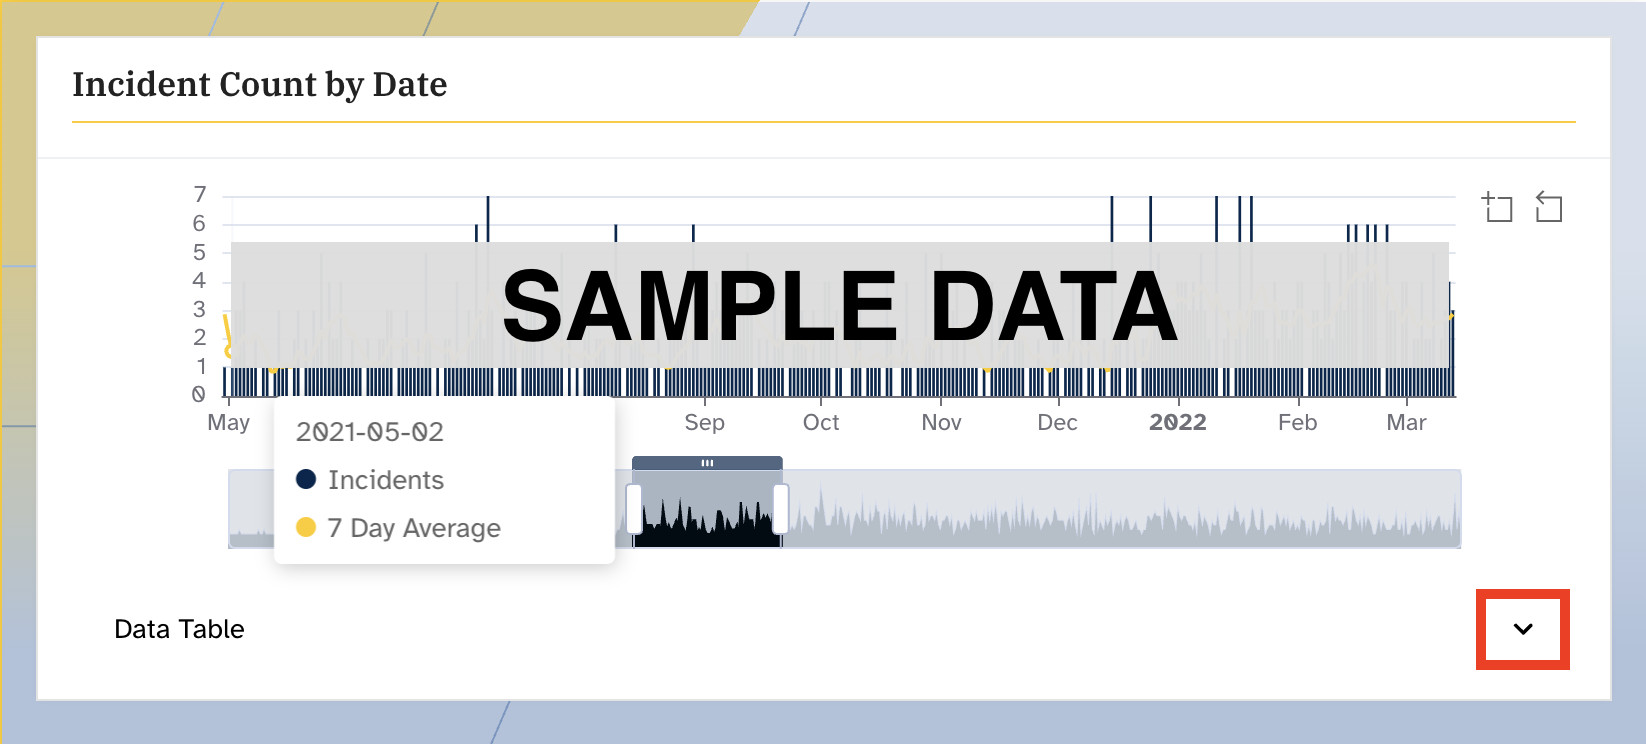
Incident Count by Date
View incident counts by date below the incident map. Hover over the timeline of aggregate data and view the total count of firearm incidents in the state of Michigan by pausing your cursor on specific dates on the timeline. To view a further breakdown of the incident counts by date information, click on the upwards-facing arrow directly underneath the map labeled ‘Data Table.’
Statewide Dashboard Page
Request access here at this page. A user can click “Request an Account” and complete a form which will put the user in a queue on the administrative side of the dashboard. If the user is activated, you should receive a welcome email with a link to set their own password and sign in.
Selection of Geographic Area:
The Mi-FINDS Authorized User Statewide Dashboard Homepage allows you to view data by city or county. By default, before additional selections are chosen, the dashboard will display aggregate data for the entire state of Michigan. To view city or county-level data, begin by selecting a Start Date and End Date in the panel on the left-hand side of the page for the date range you are interested in. Select the location of interest, city or county. Multiple cities or counties can be selected at one time. Additionally, a city and a county set of data can be viewed at one time.
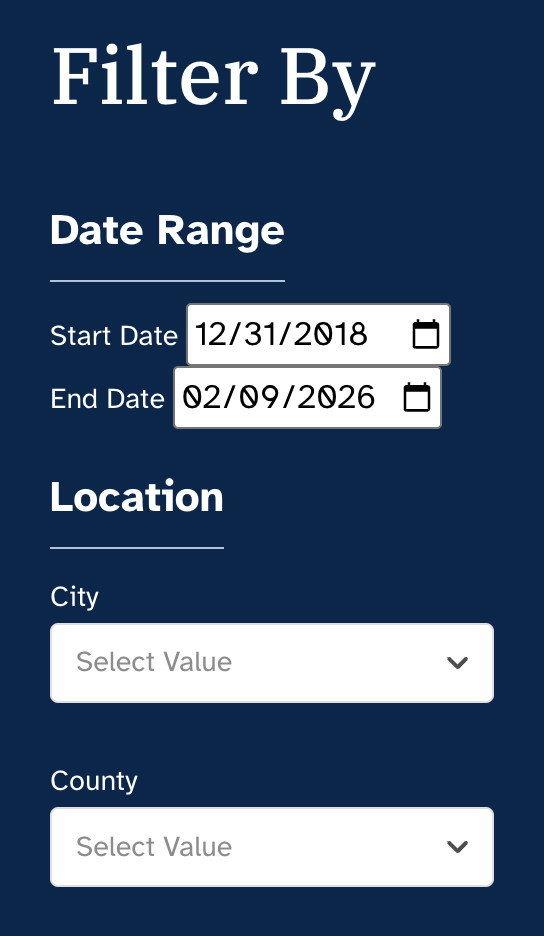
Census Overlays
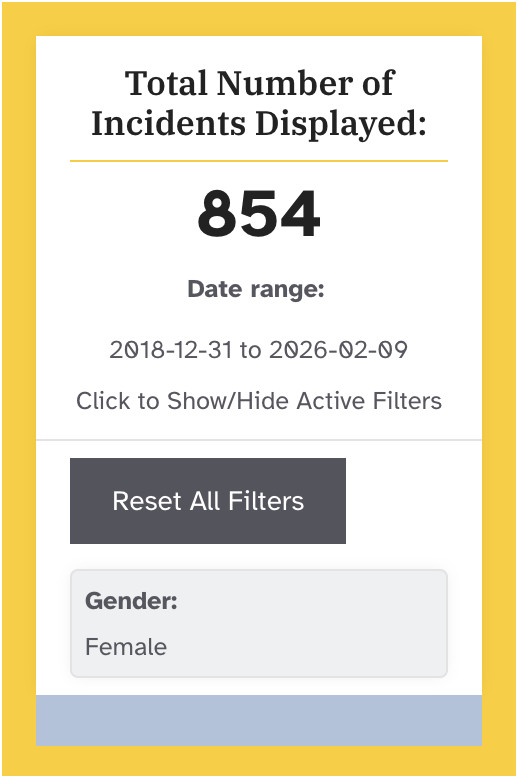
On the right-hand side of the page, a box displays the total number of incidents being viewed based on the user’s selections (e.g., city, county). If a county is selected, this box will also display the option to “Toggle Census Overlay.” If selected, an additional menu of overlays according to a variety of census tract data (e.g., Household Income) will populate. Select any overlay of interest to view its distribution across the selected geographic area.
To reset all filters, including census overlays and county selections, click on “Reset All Filters” under the total number of incidents displayed.
Demographic Information
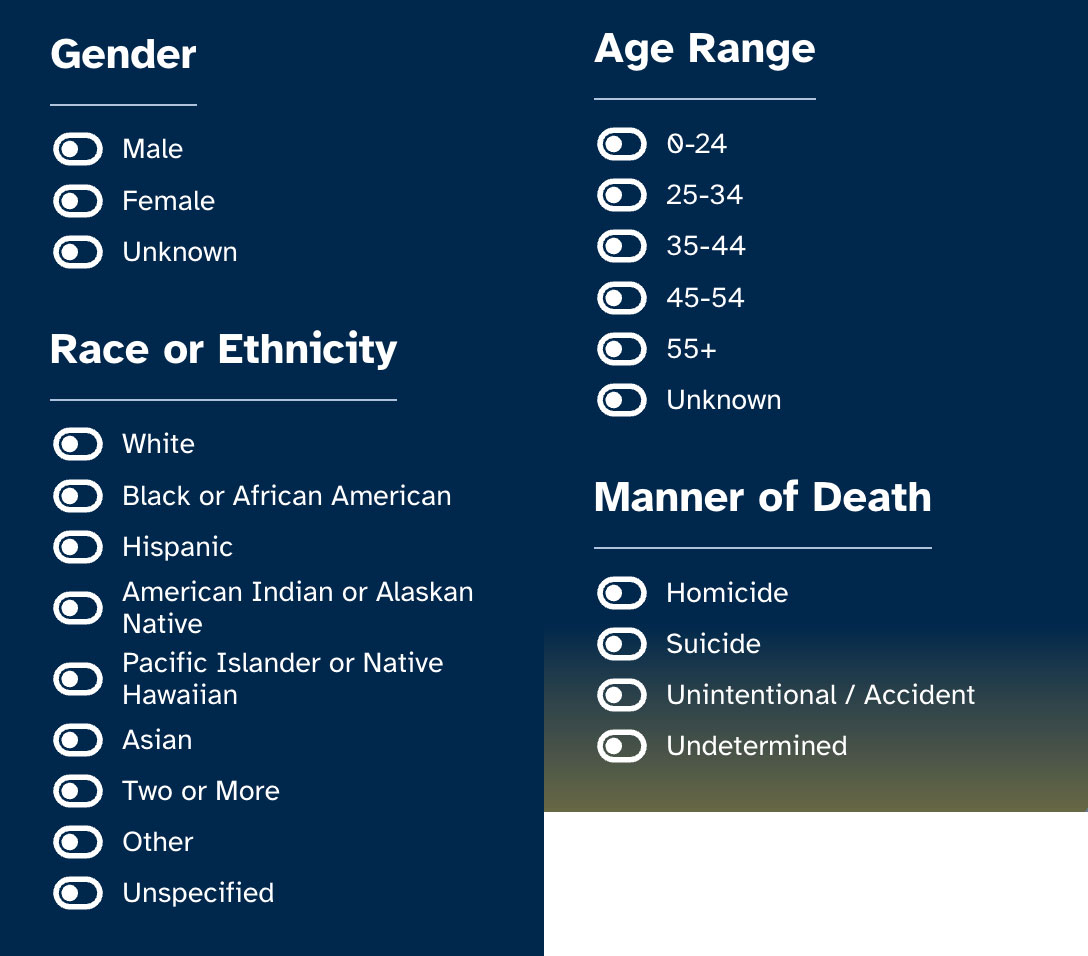
If desired, further selection of demographic information (i.e., gender, race or ethnicity, and age) is possible by toggling (i.e., clicking on) different options in the panel on the left-hand side. Data may also be filtered and viewed by the manner of death (i.e., homicide, suicide, unintentional/accidental, undetermined).
The incident map and corresponding data displays (e.g., age) will re-populate according to the selections made.
Incident Map
In the middle of the page, the incident map can be zoomed in and out according to the preferred view. To zoom in, select the ‘+’ in the left-hand corner of the incident map. To zoom out, select the ‘-‘ in the left-hand corner of the incident map.
Another option to view specific county information is available on the incident map. To do so, hover your cursor over the county of interest and select ‘Zoom to County’ to go to that county’s data. To view a further breakdown of the incident information, click on the upwards facing arrow directly underneath the incident map labeled ‘Data Table.’
Incident Counts by Date
Further down the data page, view incident counts by date in one of two ways. The first option allows the user to hover over the timeline and identify specific incidents count on specific dates, as well as the corresponding 7-day average. The second option allows the user to select time periods of viewable data using a sliding bar that will highlight the time frame of data being viewed after selection.
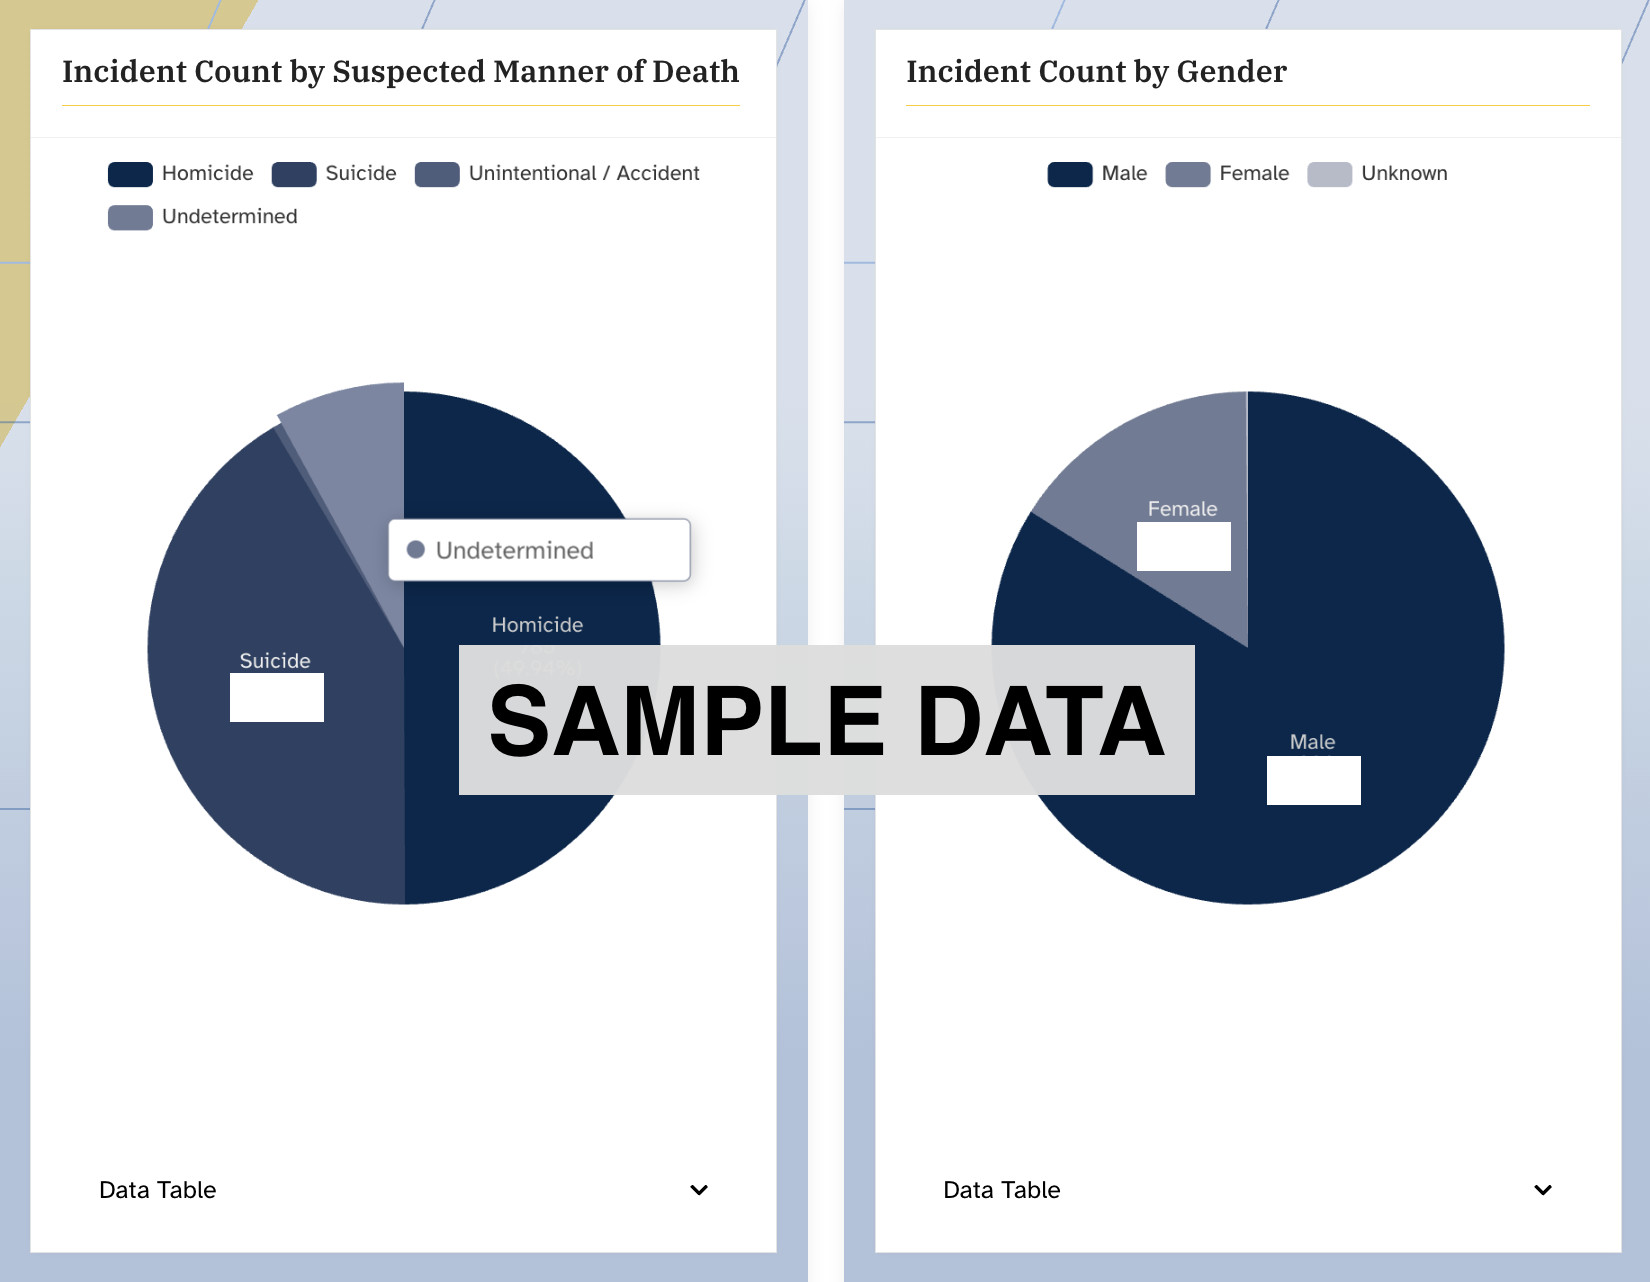
Incident Count by Suspected Manner of Death or Gender
Demographic data of the selected incidents is further viewable underneath the incident counts by date section. If desired, you can view demographic data and further stratify the data selections to view only, for example, females or according to the incident manner of death. Click on pieces of each pie chart to do so.
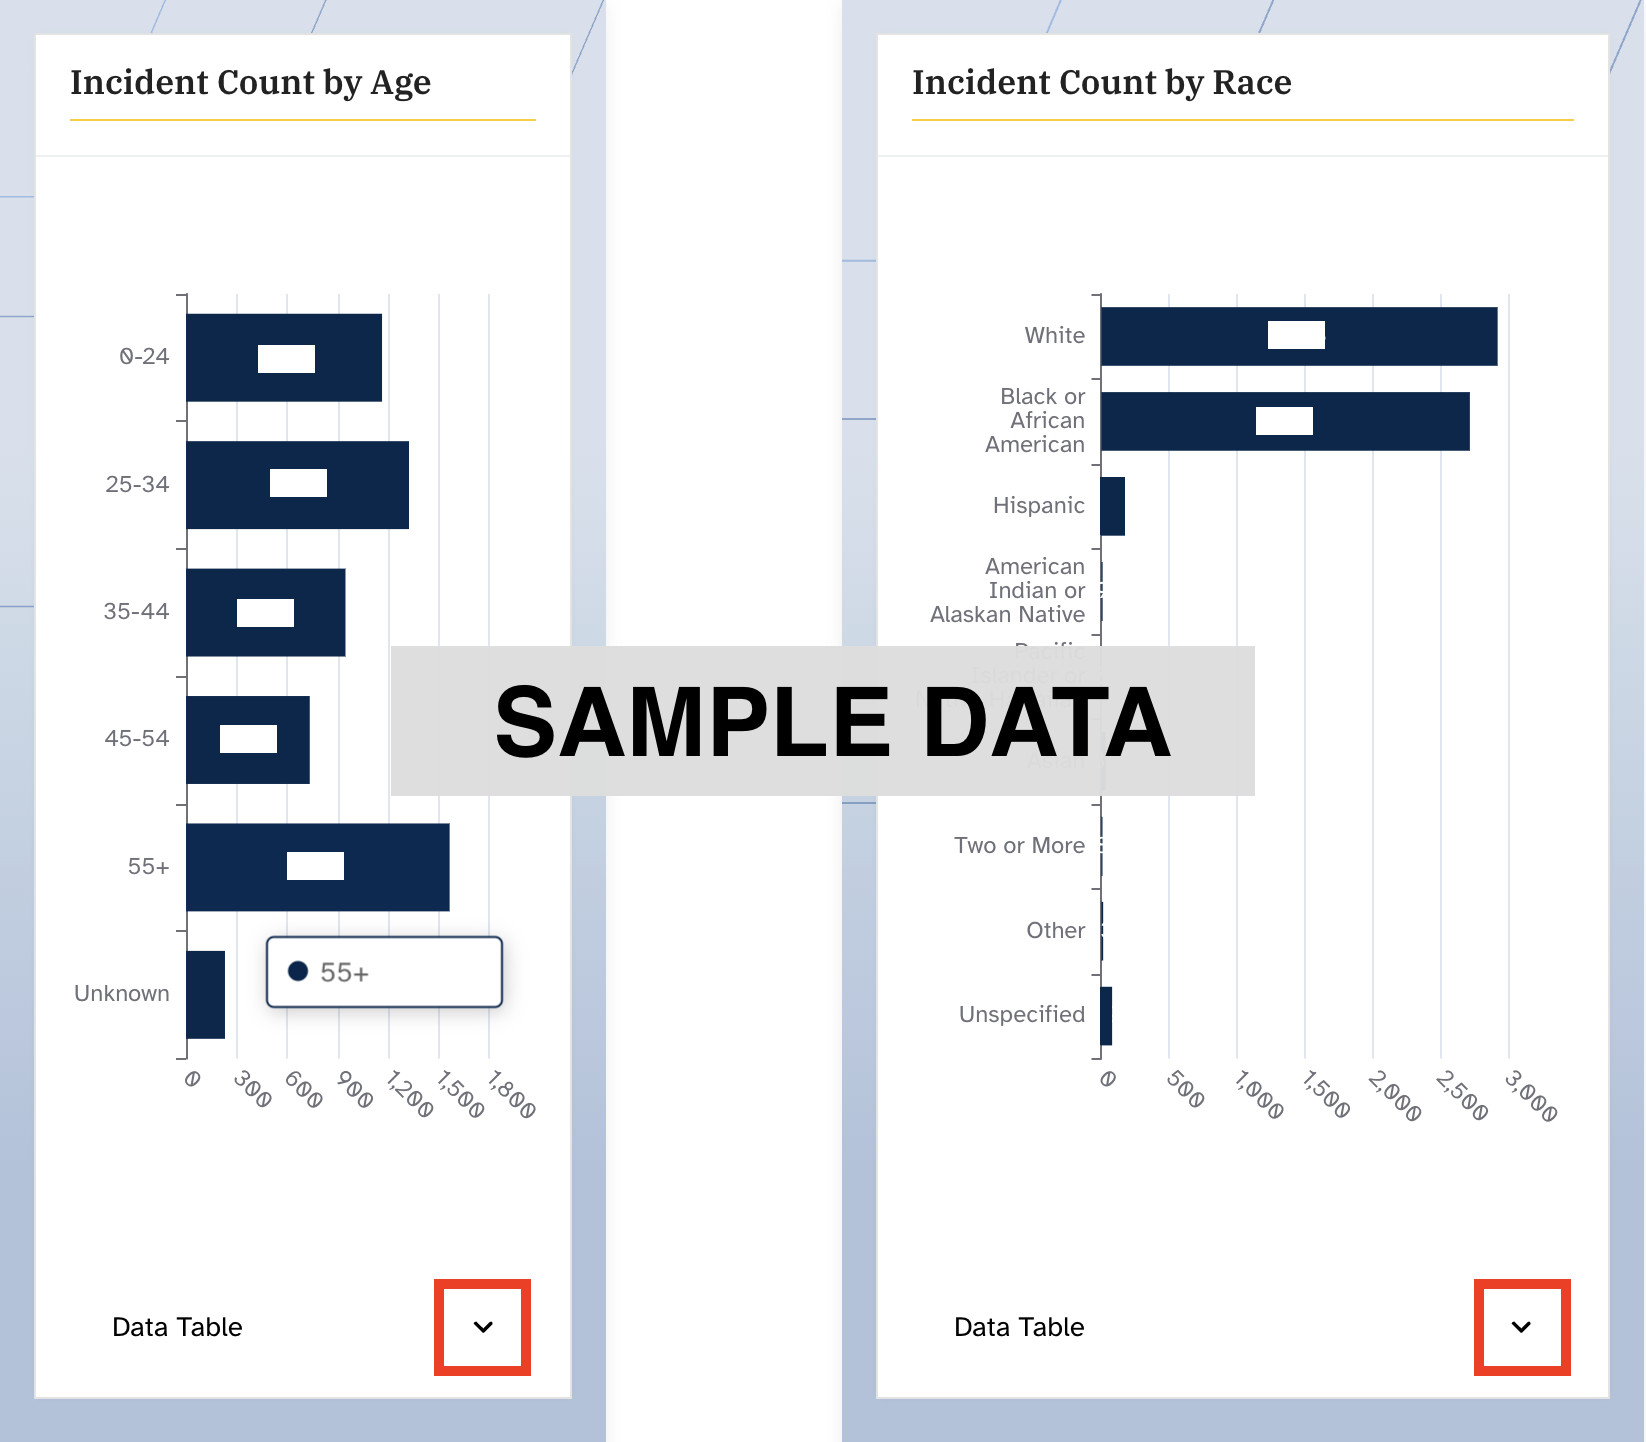
Incident Count by Age or Race
Additionally, view further demographic information on age and race or ethnicity directly below. To view specific age groups, such as those aged 0-24, click on this bar in the bar chart. The data will populate accordingly. The user may add other age categories to their selection. To view incident data by race or ethnicity recorded, the user can similarly click on one (or more) of the bars, such as Black or African American, and the data will populate accordingly.
To view a further breakdown of the incident information, click on the upwards facing arrow directly underneath each demographic data display labeled ‘Data Table.’
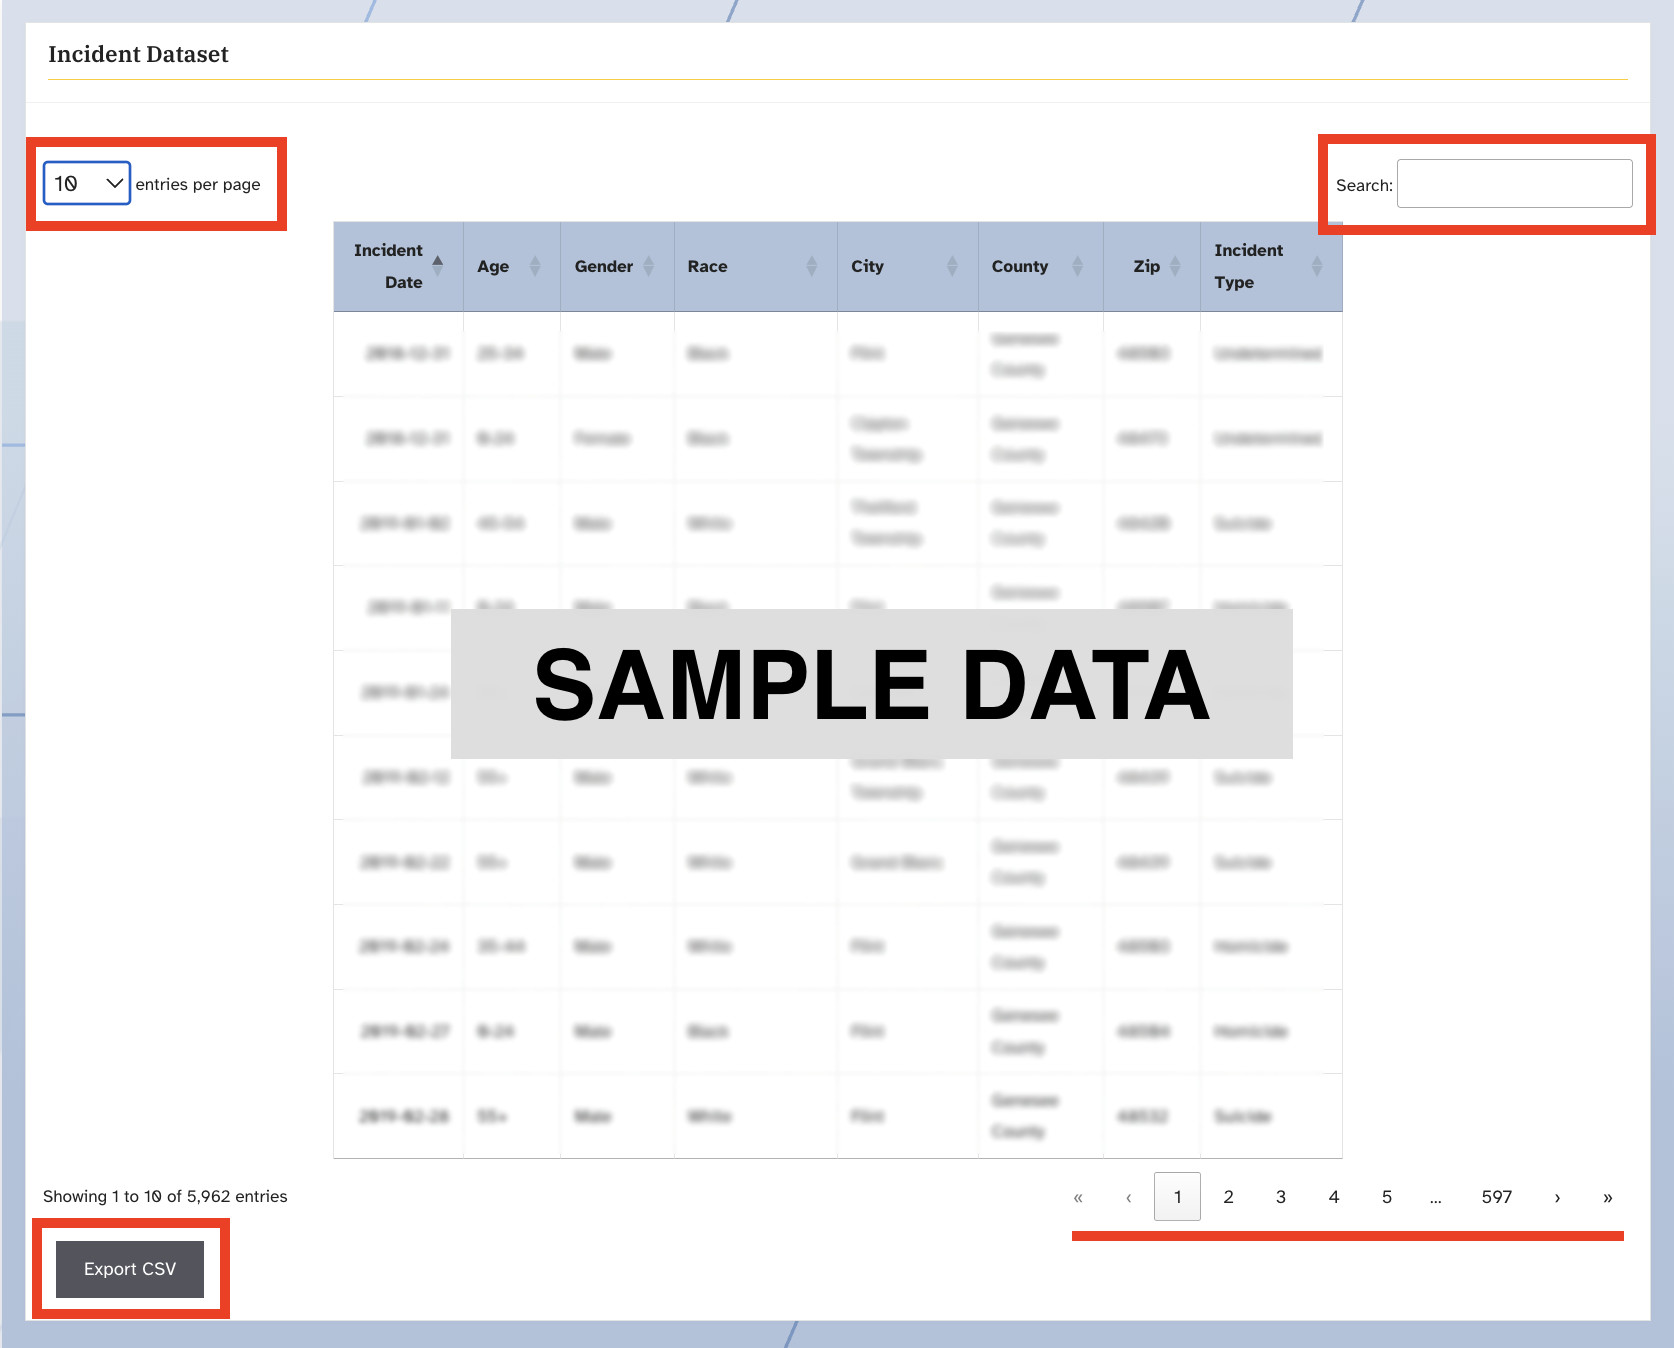
Incident Dataset
At the bottom of the page, the user may view the incidents as a dataset. On the left-hand side, you may select either 10, 25, 50 or 100 entries viewable per page. On the right-hand side, the user may search using information included in any of the 8 data fields in the table (i.e., Incident Date, Age, Gender, Race, City, County, Zip and Incident Type). Use the arrows at the bottom right-hand side of the data table to view other data pages.
Export the dataset in CSV form by clicking the “Export to CSV” button. The CSV file will be downloaded to your browser.